Use Data to Drive Informed Decisions
Training designed for data technicians, data analysts, administrative professionals, and project managers who manage men, machines and money.
Microsoft Power BI Training
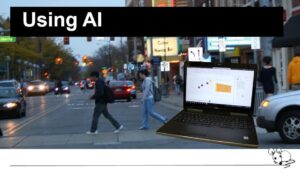
Power BI uses Artificial Intelligence, AI, to group, organize and rank the data. AI can be used to display the visuals by specific factors. Key Process Indicators (KPI) can be used to filter a report or a dashboard by category.
Microsoft Excel Certification Training
A good spreadsheet provides accurate data. The most important tools for entering, formatting and calculating information is Microsoft Excel. It is a key middle-technical skill and vital to all management positions.
Using real mobility data, this course will cover concepts from the Excel MO 201 (Excel 2019) and the Excel 2016 Course certification exams.
Smartsheet Product Training
A Dashboard is a live, interactive, view of the data. Dashboards are visual tools for users to see important information at a glance. Data dashboards can be linked to datasets and updated live.
We can use Smartsheet Dashboard to display and share reports, tables, charts, and images.
XML Master Certification Training
Learn how to understand XML documents in the context of commonly used companion codes for restricting content with XML Schema, navigating nodes with XPATH and transforming content with styles from XSLT.
BONUS: Validate the XML code with Excel